The Office for National Statistics (ONS) has just published its latest bulletin on inflation. There are a number of different inflation measures included – RPI, CPI and CPIH – but the overall conclusion is that inflation is slowly rising after a reduction at the start of the year. The rate remains over 2%, which means the Bank of England must continue to plan on how to set its policy to reduce the figure, but since it has been over 2% since January 2017, and the main driver is Brexit, it’s unlikely the government is going to be too strict about this.
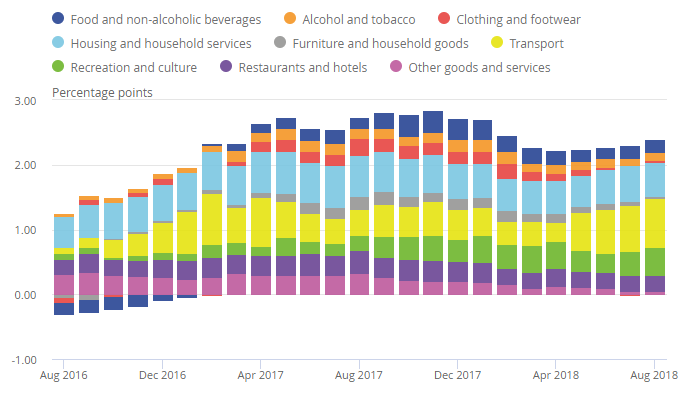
One of the more interesting graphs on the analysis shows the breakdown of inflation by sector.

This graph shows the relative size of the inflationary pressure coming for different areas of expenditure. The size of the bar for each reflects two aspects: the proportion of total expenditure on that sector, and the rate of inflation.
The large increases in inflation in recent months appear to be largely driven from increases in transport costs, and housing. As sectors see a larger inflation in prices, they will become a larger part of the total expenditure and therefore have a greater impact on total inflation. Without a careful policy focus on the correct sectors, we could end up with an exponential increase in inflation in some areas.
Perhaps more worrying is the large impact of transport costs in the last four months. Transport costs are heavily driven by fuel costs, and it is likely that these will feed through to other sectors in the near future, as transport of stock and other inputs becomes more expensive.