A fundamental concept in economics is that of trade. Two parties will want to share their possessions in a way that benefits them both. The Edgeworth Box is a graphical representation of this trading; before looking at the overall box, however, it’s important to understand an individual’s utility curves.
An individual, A, can choose between two goods. Different combinations of these two goods will give different utilities; if A had lots of good 1 and very little of good 2, they would probably be worse off than if they swapped some of good 1 for good 2. If we plot a line along which any point has an equal utility, we tend to find curves as shown below. These are ‘isoutility bands’, along which A is indifferent between any point.

This shape of utility curve demonstrates diminishing returns of scale. It is possible to plot any number of these curves, with curves further away from the origin representing a higher utility than those closer to the origin.
The Edgeworth Box looks at how two parties in a trade can come to an optimum agreement between themselves. To do this, we use two sets of utility curves, with one set inverted. One party uses the ordinary axes as shown above, and measures their utility of two goods spanning out from this.
Our second party, B, is represented by the inverted axes. The axis along the top of the box measures the same as the X-axis, except in reverse; given a fixed amount of a good, anything that A gets, B doesn’t. B has similar isoutility bands, again inverted.
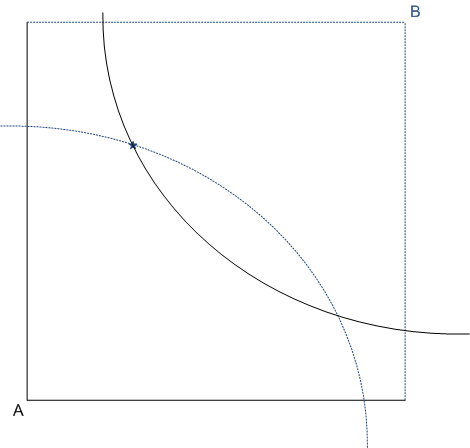
When starting a trade, we consider the initial endowment, and consider how this can be improved.
 The star here represents the initial endowment. To benefit from the trade, A and B both wish to move to a higher isoutility band. A benefits if they shift their curve to the right and upwards; B benefits if their curve is shifted to the left or down. The diagram above shows the existing isoutility bands that each currently sits on.
The space between the bands represents the “negotiation space” – this area shows all possible positions that give both A and B and increased benefit. A and B will wish to move to a new position within this negotiation space which maximises the total utility. In order to do this, A and B must trade so that there is no negotiation space – that is, there is no area in which utility could be increased.
 The optimum equilibrium position therefore turns out to be where utility bands are tangential to each other. However, this does not in itself identify the final position, since it would be possible to move A’s utility curve more than B’s or vice versa. Providing the final point exists in the original negotiation space and where curves are tangential, it is a valid trading position.
Further details on the Edgeworth box can be found here.
edgeworth box diagram and hechscher ohlin how much trade good analysis of theorem